A Viral Market Update X: A Corporate Life Cycle Perspective
Fear and greed are dueling forces in financial markers at all times, but especially so in periods of uncertainty, when they pull in opposite directions, causing wild market swings and momentum shifts. I think that no matter what your market views are right now, you would agree that we are in a period of intense uncertainty, with divergent views on how this pandemic will play out, not just in the coming months, but in the coming years. It is this divergence that have been at the heart of both the steep fall in equity markets in February and March, and the equally precipitous rise in April and May. As US equity markets climb back towards pre-crisis levels, the focus on market levels may be missing the underlying shift in value that has occurred across companies. In this post, I will focus on this shift, using the framework of a corporate life cycle, and record a redistribution of value from older, low growth, more capital intensive companies to younger, high growth companies. It is possible that this shift is the result of irrational exuberance on the part of young, inexperienced investors, but I think that a more plausible explanation is that it reflects not only the unique nature of this crisis, but also a changing business landscape.
Updating the Market
As with my previous updates, I will start with a chronicling of how markets have behaved in the two weeks since my last update, and overall, during the crisis. Let's start with equity indices, where we saw one week of relative stability (5/29-6/5) and a week of drama (6/5-6/12), after surges in April and May:
 |
| Download data |
For those who thought that the worst of the crisis was behind them, June 11 delivered the message that this crisis is not quite done, as the S&P 500 dropped 7%, and markets around the world followed. I have computed the returns since February 14, broken down into two time periods, with the first stretching from February 14 to March 20, and the second from March 20 to June 12. Every equity index that I list in this table dropped in the first phase, with some indices losing more than 30%, as fear stalked markets around the world. In the second phase, every index posted positive returns, with some climbing back almost to pre-crisis levels. I will return to look at equities in more detail in the next section, but as stocks were going through contortions, US treasury yields were also on the move:
 |
| Download data |
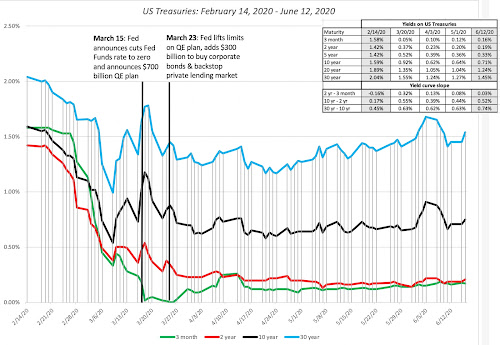
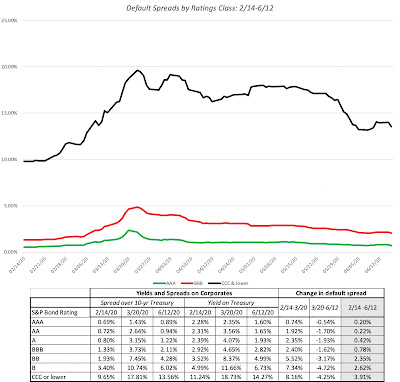
US treasury rates dropped in the first weeks of the crisis, and with 3-month yields dropping close to zero and 10-year rates declining below 1%. While it is convenient to attribute everything that happens to interest rates to the Fed, note that much of the drop in rates occurred before the Fed's two big moves, the first one on March 15, where the Fed Funds rate was cut by 0.5% (almost to zero) and a $700 billion quantitative easing plan was announced, and the second one on March 23, when the Fed lifted the cap on its easing plan and extended its role as a backstop in the corporate bond and lending markets. While treasury rates were not affected much by the Fed's actions, its entry into the corporate bond market played a key role in turning the tide, where default spreads across ratings classes had been on the rise since February 14:
 |
| Download data |
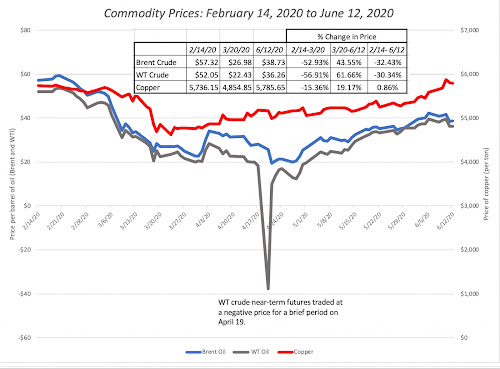
Default spreads followed the path of equities, widening significantly between February 14 and March 20, and falling back by June 12, albeit to levels higher then on February 14. The fear about how the pandemic would slow economic growth also affected commodity prices, and I chart the path of copper and oil, two commodities sensitive to global economic growth below:
 |
| Download data |
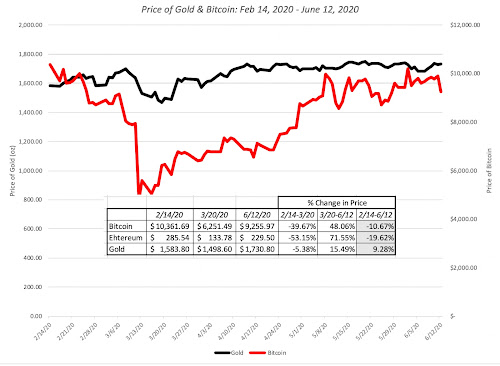
As with corporate bonds and equities, it is a tale of two periods, with commodity prices dropping between February 14 and March 20, before clawing their way back in the subsequent period. With copper, the market has retraced its entire decline, and it is now back to where it was trading at, on February 14. With oil, it is a different story, with a decline of more than 50% between February 14 and March 20 in both Brent and West Texas crude. and oil prices, notwithstanding a strong recovery between March 20 and June 12, are about 30% lower than they were on February 14. Finally, I look at gold and bitcoin, gold, because it has historically been a crisis asset and bitcoin, because it has been marketed by some as an alternative asset:
 |
| Download data |
Gold has held its value and is up 9.28% during the crisis, though it saw less upside during the first few weeks of this crisis than in prior ones. Bitcoin has behaved more like equity, and very risky equity at that, during this crisis, dropping almost 40% between February 14 and March 20, before recovering to close down only 10.67% by June 12.
Equities: A Breakdown
In keeping with a practice I have adopted on my prior updates, I downloaded individual stock data on 37,050 publicly traded global companies, with market capitalizations exceeding $5 million, and computed changes in market cap, by region:
 |
| Download data |
Looking at overall returns from February 14 to June 12, the worst performing regions in the world are mostly in emerging markets (India, Latin America and Africa), with the UK as the worst performing developing market, down about 20%. Breaking down the companies by sector, I look at returns across the period, broken down into two sub periods:
 |
| Download data |
The sectors with double digit negative returns over the entire period are energy, utilities, real estate, industrials and financials, with the first four being punished for their capital intensity and debt dependence, and financials reflecting the fear of debt defaults. Health care shows almost no change in value over the entire period, and tech is down only 3.2%. Breaking the sectors down into industries, and looking at returns over the crisis period, I list out the ten worst and best performing industries between February 14 and June 12, 2020:
 |
| Download data |
There are no surprises here, given the earlier sector assessment, with a strong representation of infrastructure and financial service companies among the worst performing sectors, and health care and technology on the best performing list.
Crisis Effects across the Corporate Life Cycle
In each update on the crisis, I have tried to look at a different facet of market performance, hoping to get some understanding of what the market is pricing in, and whether it makes sense. This week, I will use the concept of a corporate life cycle, a structure that I have found useful in thinking about both corporate financial questions and in valuation, and look at how this crisis has played out across the life cycle.
The Corporate Life Cycle
I believe that companies, like humans, go through a life cycle from newborn (start up) to toddler to teenager, peaking as successful growth companies, before becoming middle aged (mature) and then declining.
While there are companies that find pathways to reincarnation (IBM in 1992, Apple in 1999, Microsoft in 2013), they remain the exceptions to the rule that fighting corporate aging creates more costs than benefits. The life cycle is useful not just as a device for chronicling corporate age but also in identifying the challenges that companies face at each stage. It is also worth noting that the free cash flows, i.e., cash flows left over after taxes and reinvestment, vary as companies move through the life cycle:
In general, negative cash flows (cash burn) are a feature of young companies, cash build ups occur as companies grow and mature, and declining companies return cash as they shrink. Finally, to understand how companies change as they move through the life cycle, I will draw on another general construct, the financial balance sheet:
Note that young companies derive their value mostly or even entirely from growth assets, i.e., the value of investments that they are expected to make in the future, and that the portion that is attributable to assets in place increases as companies age, with mature and aging firms deriving most or all of their value from existing investments. Young companies, lacking the earnings and cash flows to service debt, are also more dependent on equity to fund their businesses than mature firms.
The Crisis Effect across the Life Cycle
A crisis tests all companies, but the dimensions on which they get tested will vary depending on where they fall in the life cycle.
- Start up and very young companies: For young companies, the challenge is survival, since they mostly have small or no revenues, and are money losers. They need capital to make it to the next and more lucrative phases in the life cycle, and in a crisis, access to capital (from venture capitalists or public equity) can shut down or become prohibitively expensive, as investors become more fearful. These companies will either have to shut down or sell themselves at bargain basement prices to larger, deeper-pocketed competitors.
- Young growth companies: For young growth companies that have turned the corner on profitability, capital access still remains critical since it is needed for future growth. Without that capital, the values of these firms will shrink towards assets in place, and in a crisis, these firms have to hunker down and scale back their growth ambitions.
- Mature firms: For mature firms, the bigger damage from a crisis is the punishment it metes to assets in place, as the economy slows or goes into recession, and consumers cut back on spending. The effect will be greater on companies that sell discretionary products than on companies that sell staples.
- Declining firms: For declining firms, especially those with substantial debt, a crisis can tip them into distress and default, especially if access to risk capital declines, and risk premiums increase.
In summary, the answer to the question of which companies (young or old) get affected more in a crisis will depend on how the crisis affects the real economy and capital access. In most crises, it is access to capital that takes the early hit, with the pain from economic effects showing up more gradually. As a result, in the first parts of the crisis, it is the firms at either end of the life cycle (young companies and declining ones) that are most dependent on new capital to survive that are hurt the most, with the pain spreading more slowly to mature firms, and least to firms that sell consumer staples. How has this crisis played out in terms of damage to companies across the life cycle? Let me start with a very simplistic measure of life cycle, company age, as measured from the year of founding:
 |
| Download data |
The table tells an interesting story. In the down phase (2/14-3/20), there was little distinction between younger and older firms, as firms in every age group lost about 30% of value. In the second phase from 3/20 to June 12, younger companies have seen a much more robust comeback than older firms, resulting in much lower negative returns over the entire period for younger firms (the bottom five deciles) than older ones (the top five deciles). You could argue that company age is not a composite measure of where a company falls in the life cycle, since some companies move through the life cycle faster than others. To counter this critique, I break firms down by expected revenue growth, as estimated prior to the crisis, building on the assumption that expected revenue growth should be highest for young firms and lower for firms further along in the life cycle:
 |
| Download data |
Note that expected revenue growth estimates are available for just over a third of all the firms in my sample, and across those firms, the differences are stark. Firms in the lowest revenue growth decile are down substantially over the crisis period (2/14 - 6/12) whereas the firms with the highest expected revenue growth, coming into the crisis, have seen their values increase over the same period.
In summary, this crisis seems to have had a much greater negative impact on older, more mature companies than on younger, high growth ones. perhaps because it started at a time, when capital markets were buoyant and investors were eagerly taking on risk, with risk premiums in both equity and bond markets at close to decade-level lows, with a global economic shut down, with a cessation of most business activity. That shut down came with a time frame, though there was uncertainty not only about when economic activity would start up again, but how vigorously it would return. Young companies have also benefited from the fact, that after being on hold in the first few weeks of the crisis, risk capital came back in the middle of March, both in public and private markets. The big story, still unfolding, from this crisis is that access to risk capital has held up remarkably well, coming back into markets earlier and in larger magnitudes, than in prior crisis. The Fed has undoubtedly played a role in this comeback, especially with its intervention in lending markets, but it has succeeded only because it tapped a willing investor base.That access to risk capital has also benefited distressed companies at the other end of the life cycle, explaining why you have seen surges in airline stock prices and in portions of the oil sector. To those who attribute the shift to amateur investors, subject to so much scorn from market watchers, there is collectively too little capital in the hands of these investors to have caused this much of a change in markets.
The divergence in the market treatment between young and older companies during this crisis also explains why value has underperformed growth, since value investing strategies skew towards more mature companies and growth investing is more focused on younger companies. It may also explain why so many market "pros" have been left in the dust by amateurs, since many of the former have been using scripts developed in prior crisis to decide when and where to invest, and this one has followed a different path. While value investors and pros may still be vindicated, the lesson that I would take from this crisis is that while it is true that those who do not remember history are destined to repeat it, it is also true that those who let history alone drive their investment decisions are in just as much danger.
Conclusion
The trajectory of markets in this crisis has followed the path of the virus, with markets rising and falling on news about viral breakouts in different parts of the world, and vaccines/medication to mitigate its effects. It should therefore come as no surprise that just as the virus has had its most deadly effects on the elderly and the infirm, the market is meting out its biggest punishment to mature and aging companies. As we pass the four-month mark since this crisis started roiling financial markets in the US and Europe, it is still an evolving story and there will be more twists and turns before it is done.
YouTube Video
Data
- Market data (June 12, 2020)
- Regional breakdown - Market Changes and Pricing (June 12, 2020)
- Country breakdown - Market Changes and Pricing (June 12, 2020)
- Sector breakdown - Market Changes and Pricing (June 12, 2020)
- Industry breakdown - Market Changes and Pricing (June 12, 2020)
- Age breakdown - Market Changes and Pricing (June 12, 2020)
- Growth breakdown - Market Changes and Pricing (June 12, 2020)
Viral Market Update Posts
- A Viral Market Meltdown: Fear or Fundamentals?
- A Viral Market Meltdown II: Pricing or Valuing? Investing or Trading?
- A Viral Market Meltdown III: Clues in the Market Debris
- A Viral Market Meltdown IV: Investing for a post-virus Economy
- A Viral Market Meltdown V: Back to Basics
- A Viral Market Meltdown VI: The Price of Risk
- A Viral Market Update VII: Market Multiples
- A Viral Market Update VIII: Value vs Growth, Active vs Passive, Small Cap vs Large!
- A Viral Market Update IX: A Do-it-Yourself S&P 500 Valuation
- A Viral Market Update X: A Corporate Life Cycle Perspective
- A Viral Market Update XI: The Flexibility Premium
- A Viral Market Update XII: The Resilience of Private Risk Capital
- A Viral Market Update XIII: The Strong (FANGAM) get Stronger!


0 Response to "A Viral Market Update X: A Corporate Life Cycle Perspective"
Posting Komentar
Catatan: Hanya anggota dari blog ini yang dapat mengirim komentar.